Dealing with memory leaks in JavaScript applications can be a complex process. In this article I’m going to show you how to identify whether you have memory leaks, analyse them and ultimately resolve them.
I’m using an AngularJS application to demonstrate the concepts and approaches, but much of this material applies to any JavaScript application.
- Understanding Memory Leaks
- What is a Memory Leak?
- Why is a Memory Leak Bad?
- Identifying Memory Leaks
- Method 1: The Wrong Way
- Method 2: The Timeline
- Method 3: Recording Heap Allocations
- Method 4: Heap Snapshots
- Analysing Memory Leaks
- Analysing the leak in Scenario 2
- More on Graphs
- Fixing Memory Leaks
- Three golden rules
- Anti-patterns to avoid
- The Future
- Weak Maps
- AngularJS 2
- Even Better Browsers
- Appendices
- Thanks
- Mysteries
- Futher Reading
Understanding Memory Leaks
If you’ve dealt with memory leaks before, or the patterns of memory usage we sometimes call memory leaks in memory managed applications, then you can probably skip to Identifying Memory Leaks.
If not let’s start with some theory.
What is a Memory Leak?
A memory leak, at least in the world of unmanaged applications, is what occurs when you allocate memory and forget to free it. In pseudo-code1:
void leaky()
{
    void* memory;
    memory = malloc(1000);
    /* malloc just gave us some memory, use it! */
}
memory will hold the address of the memory we’ve allocate. We use the memory, then the function ends. memory goes out of scope and whatever address it held is lost - but we didn’t free the memory! Not only that, we’ve lost the address of it so can’t ever free it in the future - it’s leaked.
This memory is lost to the application - we can’t release it. Only terminating the process will release it back to the operating system.
When we allocate memory and don’t release it when we are done, we have ’leaked’ that memory.
So how do we get memory leaks in JavaScript applications? We don’t allocate memory directly, the engine does it for us, and it cleans it up afterwards as well2.
If we hold on to objects longer than we need to, that will give us similar results. Let’s look at some code:
function ChessManager() {
  this.moves = [];
  this.makeMove = function(move) {
  	this.moves.push(move);
  };
  this.newGame = function() {
    moves.clear();
  };
}
Here we’ve got a bug - the newGame function doesn’t clear the ChessManager’s moves, it just throws a null reference exception. But we could use this class in our code. In theory if we keep on calling makeMove we’ll just grow and grow the moves array. This is a bug leading to memory that can’t be freed, even though we don’t need it.
That’s a contrived example of a JavaScript memory leak.
When we are finished with memory but don’t allow the garbage collector to clean it up, that’s a memory leak.
At least for the purposes of this discussion. We’ll see it’s a very easy thing to do.
Why is a Memory Leak bad?
It might seem obvious but let’s just make sure we’re explicit with everything. As we said in the initial definition, we allocate memory but don’t deallocate it.
In some circumstances, this is not necessarily a disaster, if we don’t leak too much too often, but there are circumstances where this is very serious.
Memory leaks cause performance problems, slow down applications and can lead to a process terminating. There are some times when that’s really not good.
Servers and high performance applications shouldn’t leak, especially as many should be expected to run for long periods of time. Mobile apps or apps for embedded systems will need to deal with fewer resources and will suffer if they leak. Any application an end user is expecting to use for a long time will cause a lot of frustration if it leaks.
That’s enough theory, let’s actually start looking at identifying memory leaks in the context of an AngularJS application.
Identifying Memory Leaks
I’ve created a sample app for showing photo albums which is leaky in parts. The app is at:
dwmkerr.github.io/angular-memory-leaks
It’s a very basic app with a fairly common set of components; Bootstrap, jQuery and AngularJS. We’re going to take a look at how we can identify whether this app suffers from memory leaks.
You can run the app in your browser, or run it locally with the commands:
git clone https://github.com/dwmkerr/angular-memory-leaks.git
cd angular-memory-leaks
npm install && bower install
gulp
Running gulp will serve the app, lint, and reload the browser when you change the code. The project page is at github.com/dwmkerr/angular-memory-leaks.
Method 1: The Wrong Way
First, just be aware that the wrong way to look for leaks is by examing the memory usage of the Chrome process. While an increasing amount of memory usage can indicate a leak, it is not reliable. Why?
Well browsers can allocate memory and use it how they want to. A page it is rendering may no longer need as much memory as it needed before, but that doesn’t mean the browser needs to release it to the OS. It may just keep it to avoid having to re-allocate it later on.
Method 2: The Timeline
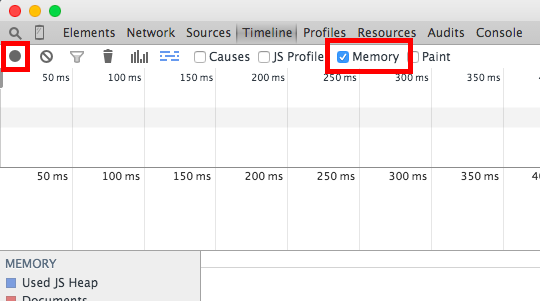
Open the Chrome developer tools. Go to ‘Timeline’ select ‘Memory’ and hit ‘Record’.
Now start using your application. After you are done, stop recording. You’ll see a graph of memory usage.
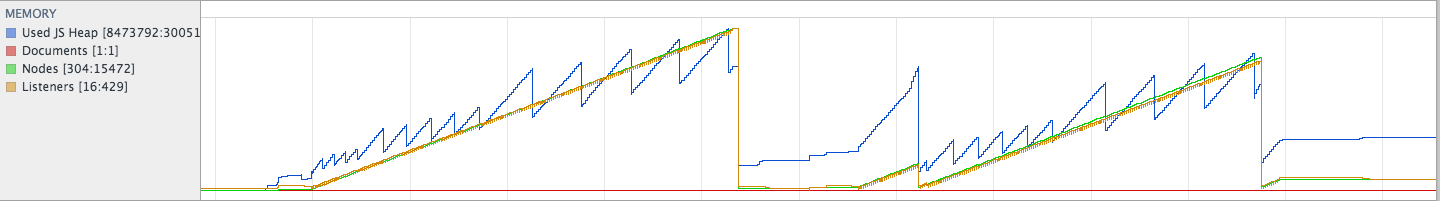
This is almost exactly what we need. I’ll explain the almost shortly, but lets take a look at this graph.
- We see a Used JS Heap in blue. Used is important here - Chrome is telling us that there may be more heap usage than shown in its actual process, but what we are seeing here is what is actually used by the page.
- We see documents (in this case a steady value of one document).
- We see DOM nodes. As I use the app the nodes increase, up until a certain point and then they drop.
- We see Listeners (i.e. even handlers). Again, these increase as I use the app and then drop.
So what should we be looking for in this graph? That depends on what our app is doing. But let’s imagine the we are navigating through different photo albums in the albums app. We’ll need more memory to see each album, but once we leave an album we don’t need that memory any more. So we should get a healthy saw-tooth pattern3:
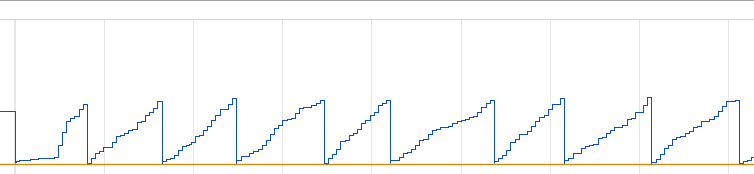
Here we see that we use more and more memory, up until the point that Chrome garbage collects, then goes back to where we started. This is repeated again and again. This is a good sign - when Chrome garbage collects we go back to the same place we started, a strong indication we are not leaking much memory.
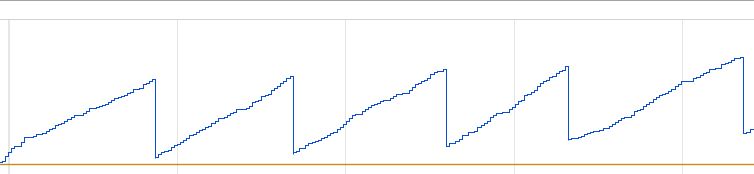
If we are doing some work which simply needs more and more memory, and we don’t release it, we would expect to see steps instead4:
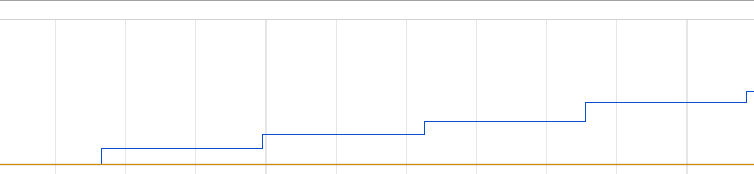
An example of this might be an infinite scroll situation. I’m looking through a vast photo album, and when I get to the bottom of the screen I load more images automatically. The ones I’ve loaded are still in the DOM so cannot be released. We see no saw-tooth because there’s no release of memory. However, this is not a memory leak - it’s just increasing memory usage. It does mean that if we allow the user to scroll too much we may run out of resources though.
The dangerous case is the one below:
Let’s imaging we’re using the application, navigating through albums, returning the the home page, looking through some more albums and so on. We keep using memory, and Chrome keeps on garbage collecting, but we never quite get back to where we started. We are trending towards increasing memory usage. This indicates we might be leaking memory.
Might is not going to cut the mustard, we need to know categorically what is going on and whether we have a leak.
You said this is ‘almost’ exactly what we need?
Unfortunately, you cannot always trust this graph. See Mystery 1 for the ugly details. Suffice to say that what we’re seeing here is an indicator only, but for more detail we need to look at Method 3.
Method 3: Recording Heap Allocations
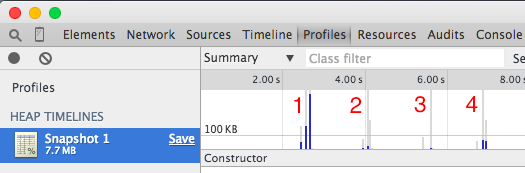
Let’s look at a different way of seeing if we’ve got a leak, the ‘Heap Allocations’ view. In the developer tools, go to ‘Profiles’ and ‘Record Heap Allocations’:
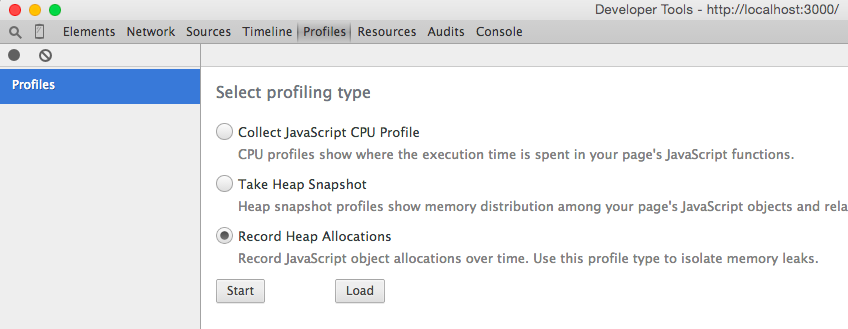
When we record heap allocations we get a chart showing us spikes as we allocate memory. These spikes are initially blue (meaning Chrome is using the memory), then change to grey once the memory is freed. If we see spikes or sections of spikes that remain blue, we may have a problem.
Try this, go to the Ablums app and start recording. Click on the ‘India’ album, then go back to the home page. You should see a chart like this:
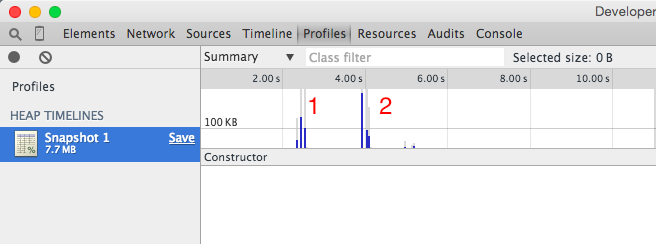
So we start recording and nothing is being allocated. Then we click on the ‘India’ album (point 1) and we get a few spikes, as chrome allocates memory needed for the content in the new page. Then we click back on the home page (point 2). Some of the memory used in the India album is released (it looks like about half). One spike of memory used for the home page is still in use (what we’d expect) and another spike or two seem to be freed. These other spikes might be memory used for the actual transition, for example in logic in the router.
So this looks like we may have a problem in the album page. In fact, we can drag a selection box around those first three spikes and see what is still in memory (i.e. what might be a potential leak) in the view below:
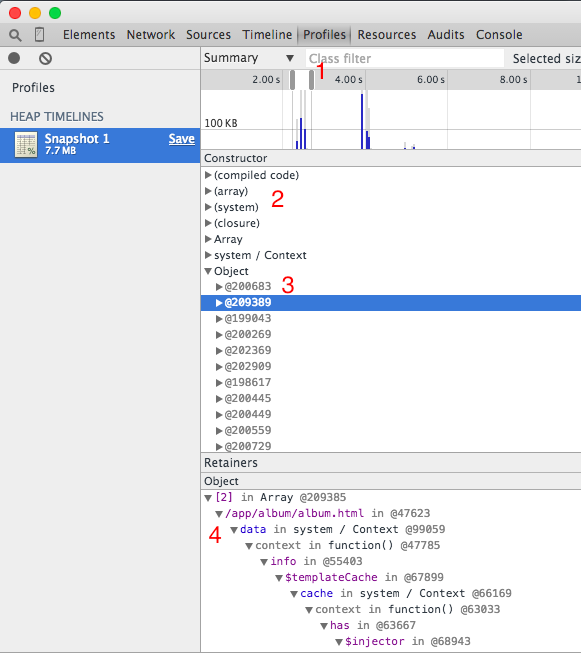
Dissecting this view we have:
- A subset of the data, the blue spike from the album page which is still in use.
- The ‘Heap View’, which shows us different types of data in memory. Don’t worry, we’ll see a lot more on this later.
- An instance of a specific type of data, in this case an instance of a JavaScript object.
- The retainers graph for the specific object.
We’re going to look into what all of this means in a lot of detail as we go through the article. For now, I’ll simply state what we’re seeing, by the end of the article you’ll be able to analyse this (and much more) yourself.
In this snapshot we see a small amount of data still in use. A quick look through the data reveils we have data still in use which relats to the AngularJS template cache.
This is good! It means this is probably not a leak. When I first visit the album page AngularJS is caching the template used to render it, so of course it stays in memory.
When analysing memory usage remember that caching, preloading and other optimisation techniques may cause some noise.
So if we have the albums page in a cache, in theory the next time we visit the page and then return to the home page, we should free a lot more of the memory (because the new memory we allocate will be just for the page itself, not the cache which is already set up). Let’s try it. We’ll record going to the album page, back to the homepage, then the album page and back again:
This is looking good.
- We go to the ‘India’ album. Some memory used is now freed, but much is still in use. As we saw, at least some of that is the template cache.
- We go back to the home page, lots of memory is used but by the time we’re done recording it’s almost entirely freed.
- We visit the India album a second time, requiring some memory almost all of which is freed.
- We go back to the home page. Some memory is used during the transition and to render the page, some of that is still in use (which is expected as the page is still open).
The heap allocations chart is exceptionally useful in identifying memory leaks, it has already led to some insights:
- Initial loading of pages increases our ‘baseline’ memory footprint due to data being added to caches (such as the AngularJS template cache).
- Subsequent loading of pages requires memory, but the vast majority of it is freed.
One thing we noticed from this brief analysis was that the initial result was slightly misleading. With the heap allocations view repeated operations can help you identify trends. In the Albums application I’ve actually set up part of the app to run repeated operations, so we can try to consistently test scenarions. The ‘scenarios’ menu lets us run them. Let’s try running scenario 1.
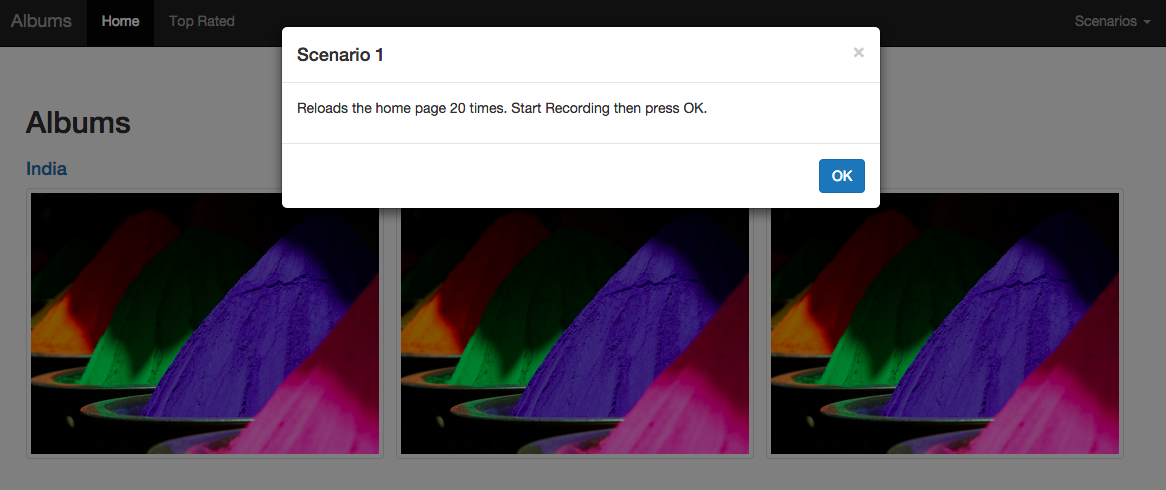
This scenario will navigate from / (the home page) to /nowhere ten times. /nowhere isn’t matched by the router so takes us back to the home page. This has the effect of reloading the home page 20 times (just reloading doesn’t work, the router is smart enough to realise we’re staying on the same page).
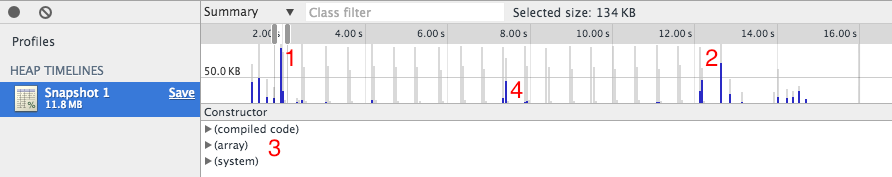
While you are recording the chart you can see peaks go from blue to grey as memory is freed. Let’s see what we’ve got.
- Shows our first navigation, some memory is not freed. Everything before this is setup code.
- Our last navigation. Some memory still in use (as expected).
- A glance at memory in use shows some compiled code and system data (more on this later). At this stage we don’t need to worry, Chrome will allocate data like this when it needs to.
- It looks like the 11th page load didn’t free all of it’s memory. This is potential cause for worry.
Altogether this a very healthy looking scenario. The huge majority of what we allocate is freed, as we would hope. Small amounts of memory stay in use (mostly used under the hood by Chrome) and a small amount of memory after the 11th reload is not freed (a quick look suggests a timing issue, definitely something we’d want to investigate further in a real-world app). Our allocations are in the 50 KB to 100 KB range and we’re looking good.
Before we say goodbye to the Heap Allocations view (for now) let’s do the same for Scenario 2 (moving from the home page to the top rated page 10 times).
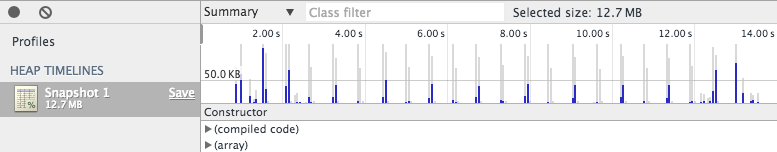
We are not going to analyse this issue (yet!) but this is an example of a much less healthy chart. In this chart we seem to be allocating memory for each page view and not releasing it. This kind of chart definitely indicates that there could be problems.
So we’ve seen the Heap Allocations view, which is a bit more sophisticated than the memory usage graph. Let’s look at the last way to analyse memory leaks - snapshots.
Method 4: Heap Snapshots
The final method of identifying memory leaks is the most sophisticated and finely controlled. We will take snapshots at specific points in time and analyse the differences between them. To take a snapshot, we go to the Profiles view and choose ‘Take Heap Snapshot’:
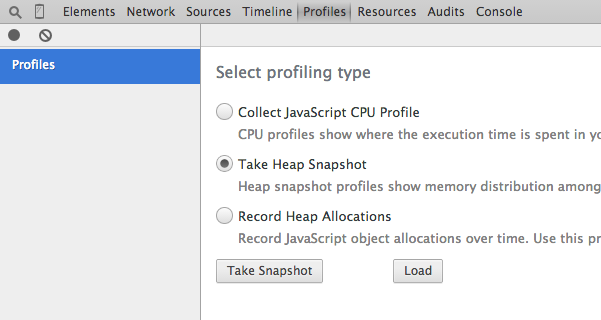
When we take a heap snapshot Chrome simply records the details of all memory allocated.
Remember: Taking a Snapshot always runs garbage collection first.
A heap snapshot shows you exactly the same kind of data you get in the Heap Allocations view, except that you are seeing ALL memory in use, not just objects which were allocated and are still alive:
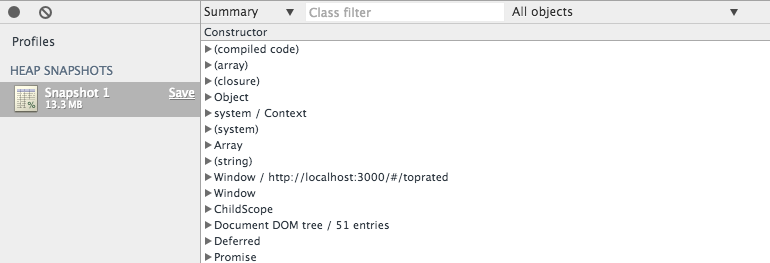
This view is very complete but not necessarily very useful. There’s some extra ways to see the data (if you change from ‘Summary’ to another view or change ‘All Objects’ but we’ll see that later).
Staying on topic, we’ll not yet look in detail at what the data is that we are seeing, we’ll first look into identifying whether there are memory leaks - then we’ll look into tracking them down.
Indivdiual snapshots are not so helpful for checking for leaks, but what is very helpful is the ability to compare memory used between snapshots.
Let’s take some snapshots, try this:
- Open the app.
- Navigate to the top rated page (caches should now be set up).
- Navigate to the home page. Take a snapshot.
- Navigate to the top rated page. Take a snapshot.
- Navigate to the home page. Take a snapshot.
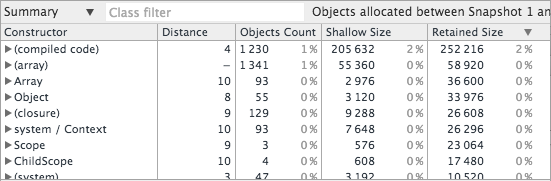
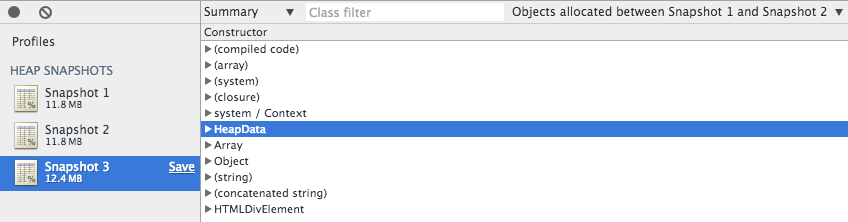
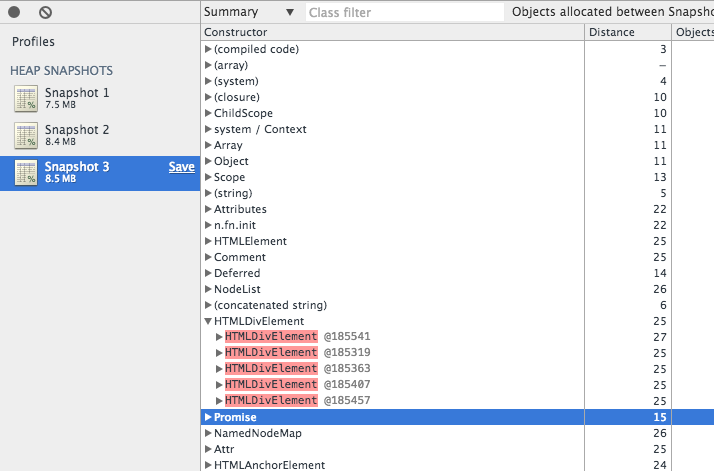
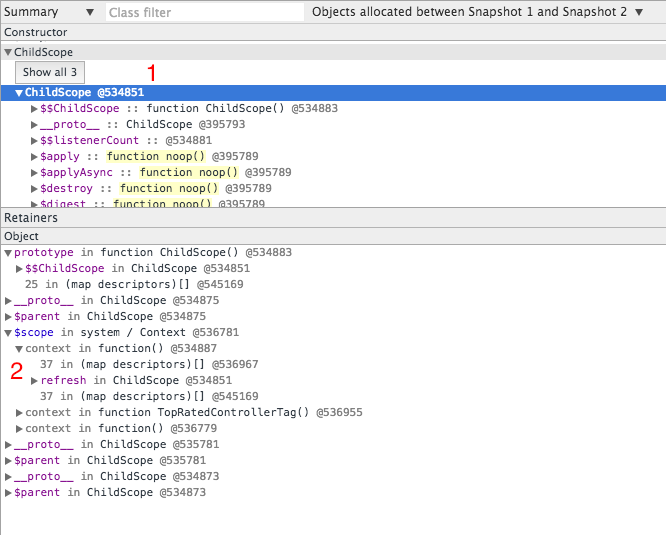
Now we can do something really cool. Select snapshot 3, and choose to view data allocated between snapshot 1 and 2. This means we’re seeing data allocated for the top rated page, which is still in use when we go back to the home page, i.e. probably leaked.

So what are we seeing now?
- We have three snapshots. The size of each one is shown. Sometimes the very first one seems overly high. See Mystery 2. We have selected the 3rd snapshot and are therefore only able to see data still present in this snapshot.
- We are chosing to show only objects allocated between Snapshot 1 and 2, i.e. objects allocated to present the page. But we’re in snapshot 3, so we’re seeing those objects which were allocated and are still present.
- Objects allocated are looking suspicious - we’ve got DOM elements. This doesn’t look good!
This is the best way to identify memory leaks. So now that we’ve seen how to identify whether we have memory leaks, or at least that we have a potential problem to analyse we can move onto step 2 - Analysing Memory Leaks.
Analysing Memory Leaks
If we think we have a memory leak, we need to be able to look at the heap data and see what’s going on. Whether we are seeing heap data from a selection of allocations from the Heap Allocations view or from the Heap Snapshots, we see the same kind of information:
Starting from the left we have the ‘Constructor’ column. This is the type of object we have. Some of these objects we can see are JavaScript classes (constructed with a new call to a function), such as Scope. As well as our own classes, we have some special classes of data:
- (compiled code): Represents JavaScript code compiled by Chrome. Consider this internal - we have no control over it.
- (array): Internally used array object. Again, internal.
- Array: A JavaScript array. Often we have a lot of data in arrays.
- Object: A plain old JavaScript object.
- (closure): A closure.
- system / Context: The underlying data require to call a function, for example the actual data used by a closure.
- system: Internally used data.
There are also plenty of objects that are created by Chrome, such as HTMLDivElement, which is a wrapper around the internally used (native) DOM object.
Let’s dissect some of these objects in detail. Running Scenario 3 allocates some data and puts it on the window object. This is really trivial data but shows a lot. You can use the Heap Allocations View or Heap Snapshots to see the data. I’ve taken three snapshots (once before pressing OK, once after the data is allocated, and the final one when the last modal is closed):
This data has come from the code below:
//  Create a class which will hold heap data. Makes it easier
//  to find the data in Chrome.
function HeapData() {}

//  Create a heap data object.
var heapData = new HeapData();

//  Create a function that multiplies two numbers.
function multiply(a, b) {
  return a * b;
}

//  Create a 'multiply by' function, which curries the above
//  to generate a function which multiplies by a constant. This
//  will involve closures.
var multiplyBy = function(a) {
  return function(b) {
    return multiply(a, b);
  }
};

//  Add some data to our heap data object.
heapData.fry = "Philip J. Fry";
heapData.zoidberb = "John " + "Zoidberg";
heapData.character = {
  firstName: "Amy",
  secondName: "Wong"
};
heapData.double = multiplyBy(2);
heapData.multiplyBy100 = multiplyBy(100);
heapData.doubledNumber = heapData.double(18);
heapData.multipliedNumber = heapData.multiplyBy100(15);
heapData.div = document.createElement("div");

//  Put the heap data on the window, it is now pinned to a GC root.
window.heapData = heapData;
We’ve got a little bit of everything here, some code, some closures, some objects and a DOM element.
As we’ve put most of this data on the heapData object, which is an instance of HeapData we can easily find the object:
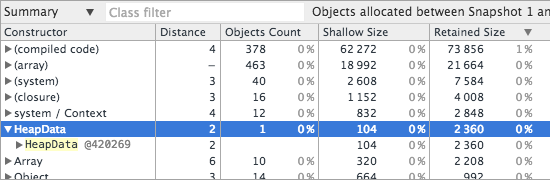
So we can see the HeapData constructor, expanding it we see an instance of HeapData. The @420269 is a unique ID assigned by Chrome. If we have lots of heap data objects, we can use this to distinguish between them when we’re looking at other parts of the snapshot. What else do we see?
- Distance. How far the instance is from a GC Root. A GC root is anything that can ‘pin’ objects, for example the
windowobject which holds globals. If put something onwindowit will never be freed, this is what makes it a GC root. Our distance is 2 as we haveHeapData(constructor) toheapData(instance) towindow. - Objects count. Only valid for the top level nodes, this shows us how many objects of the specified type we have. We have 1
HeapDataobject. - Shallow Size. The size of the data that is directly allocated for the object. Compare this to Retained Size.
- Retained Size. The size of data this object is retaining. For example, out
heapDatainstance holds a reference to an object which contains two fieldsfirstNameandsecondName. Our shallow size includes enough data for the reference, the retained size includes the full retained size of the retained object.
Notice that our instance of HeapData is highlighted in yellow? That’s a convenience from Chrome, it’s showing us objects which are directly accessible from JavaScript. Our object can be accessed via window.heapData, therefore it’s directly accessible. Other objects we’ve created might not be (for example, a variable used in a closure exists and is on the heap, but not directly accessible).
Let’s see some other data we allocated:
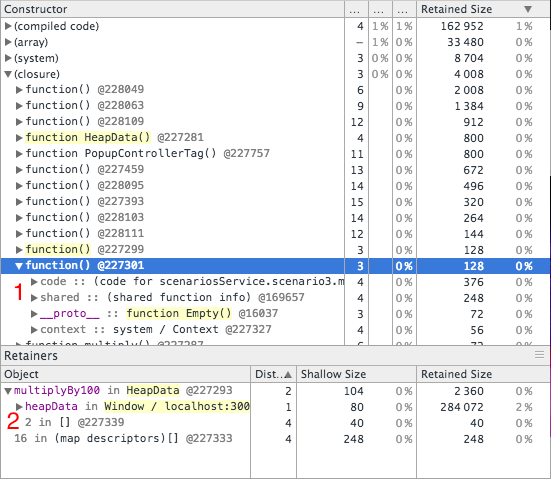
Now we’re looking at closures. We have two closures in yellow next to each other, clicking on one shows the retainer graph. What is going on here?
- Our closure is not a simple thing. It has code (of course), which takes up memory. We won’t look into this in detail. It has shared function data (again, internally used and not worth looking into). We also have a reference to a
__proto__(a function object has a prototype!). Finally, we have the context, which contains enough data to call the function. If we look in to the context we will not see much, as our function contains numbers which Chrome can simply store in the code. However, if we use references in closures we’ll actually see them in the context. - We also have the retainers. Our closure is referenced via a variable called
multiplyBy100, which itself is referenced byheapData, which if referenced by thewindowGC root. - The
multiplyBy100variable is also dominated by the second element of an array with id@227339.
The last thing we’ll look at in this snapshot is the div element.
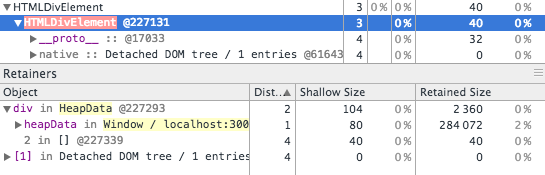
We can see the div element is retained by the div variable in the heapData object. We can also see it is made up of a prototype and some native object. The native object shows no size - don’t be fooled. That just means its taking up no JavaScript heap memory. It is still using memory (just in V8 engine not the JavaScript code).
What’s important to note here is that the element is shown in red. This means it’s detached. So it exists, is referenced (and therefore cannot be garbage collected) but is not in the DOM. This is not necessarily a problem, but lots of detached DOM elements is often a bad sign, especially if the number is increasing.
The rest of the data you can look through yourself. You’ll notice some interesting things, such as how concatenated strings work, but the important stuff we’ve now seen.
Let’s move on to analyising the first potential memory leak we discovered - the transition to the Top Rated page of the albums app.
Analysing the leak in Scenario 2
We saw that Scenario 2 (switching to and from the ’top rated’ view) seemed to leak memory. Let’s use the heap snapshot comparison view to analyse this further. The steps are:
- Navigate to the home page.
- Navigate to the top rated page (setting up the cache).
- Navigate to the home page, take a snapshot.
- Navigate to the top rated page, take a snapshot.
- Navigate to the home page, take a snapshot.
We can now look at the memory allocated between 1 and 2 which is present in 3 (i.e. what we allocated for the top rated view and potentially leaked):
Some things jump out immediately:
- We have gone from 7.5 to 8.4 to 8.5 MB. We are changing from one view to another - and ending in the same place that we started. We should be going back to 7.5 MB.
- We’ve got a lot of objects still hanging around, not just system data like compiled code, but HTML elements, detached DOM elements,
Promiseobjects,n.fn.initobjects and so on.
This looks like a classic leak situation. Let’s start by looking at some objects we recognise. There are some Scope objects near the top of the chart, let’s look at those.
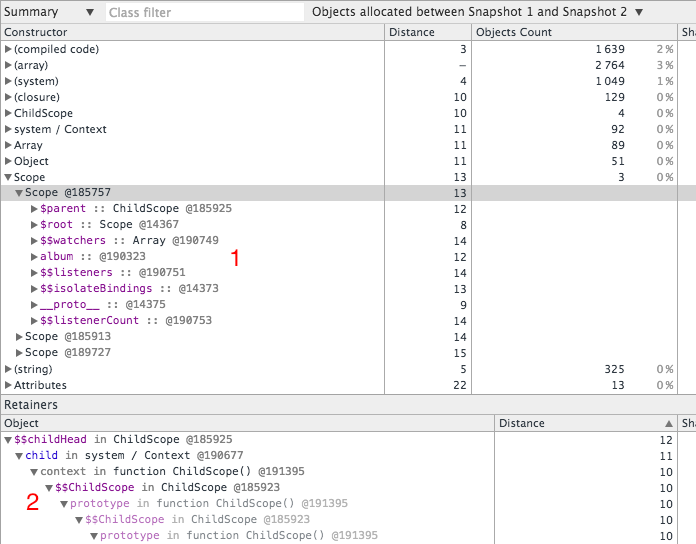
We’ve got some Scope objects, three in fact. These objects contain the usual AngularJS fields such as $parent, the only field which distinguishes this scope is the album field. If we look at out aml-rated-album directive it looks like it could be the isolated scope for this directive:
.directive('amlRatedAlbum', function() {
  return {
    restrict: "E",
    scope: {
      album: "="
    } // etc
This scope has an album field. There are three albums so it looks likely these are the three albums in the top rated page, the scopes stil in memory. What retains them?
Looking at the retainers (at 2) we don’t see much. We’re retained by a $$ChildScope, which also retained by a $$ChildScope object. In fact we have quite a complex graph of objects.
When we leak a scope in AngularJS, we leak a huge graph of objects.
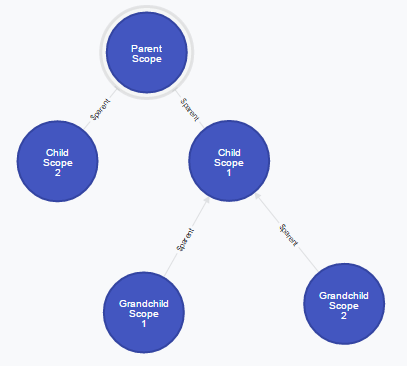
Scopes know about their parents. They also know about their children, and siblings. If we inadvertantly pin a scope to a GC root, we will probably leak almost all of the scopes in the page.
Why? The graph below should show why. I ’leak’ a scope, and by doing so I retain all of the other scopes, because they are connected. Having a connected graph of scopes is required for angular to work, but it means that we we are extremely susceptible to leaking a lot of data.

This graph shows $parent retained relationships, but don’t forget scopes also know about their children and their siblings, so real graph is even more highly connected.
So just grabbing a specific scope is not good enough. We need to try and be a little bit more specific. Let’s try starting from an element instead. Here we take a look at a div element and its retainers:
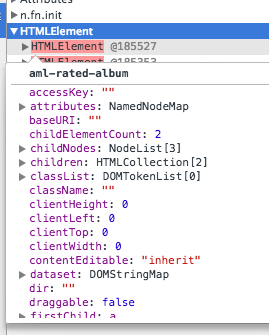
Resting the mouse over the instance of a leaked HTMLElement shows a bit of data about it, it’s a aml-rated-album and it is detached. Definitely a symptom of our leak. Let’s see the retainers:
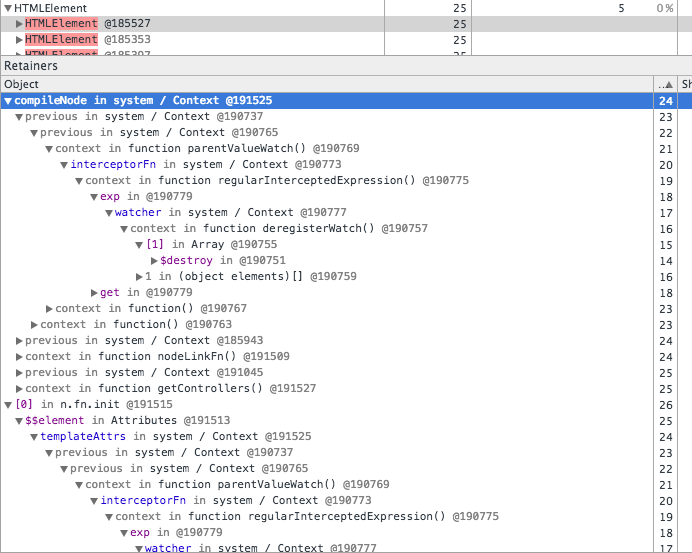
Ouch. This is nasty. Again, we are not seeing much that is particularly useful. We have a long graph of retainers starting with the compileNode function, we also have an array in a n.fn.init function. To cut a long story short, we’re are not going to easily find the root cause here. But I will share some hints.
jQuery isn’t leaking.
We will end up seeing so much jQuery stuff it is natural to wonder whether jQuery is leaking. Almost certainly not. In the graph about n.fn.init is just a jQuery selector, held onto by $$element. No surprise - all angular elements are jQuery or jQuery light objects. We’ve leaked an element, it just happens to be wrapped in a jQuery selector. (You might see a different type of graph, probably due to the jQuery 1 + AngularJS 1.2 combination, we’ll see it later).
You may see low level arrays containing data associated with a scope in jQuery, again, don’t worry. It’s the jQuery data cache (which we’ll also see later), which is associating elements to scopes.
We can try and work through this graph, but let’s try another tack.
It looks like we’re probably leaking the whole of the top rated view. We’re probably leaking the main scope for the view, created by the TopRatedController. Let’s see if we can find it.
You can find objects you think are leaking by tagging them with classes!
This is a neat trick. Let’s add a couple of lines to our top rated controller:
angular.module('app')
.controller('TopRatedController', function($scope, $http, $interval) {

  //  Create a class, assign it to the scope. This'll help us
  //  see if $scope is leaked.
  function TopRatedControllerTag() {}
  $scope.__tag = new TopRatedControllerTag();

  //  etc...
});
Now when we run the analysis again, we can search in the snapshot for TopRatedControllerTag:
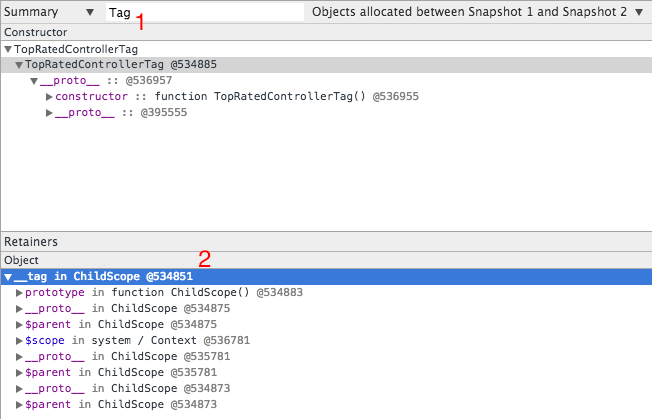
- We search for ‘Tag’, finding one instance of the
TopRatedControllerTag. - Bingo - it is retained by a Scope, with id
@534851
Let’s look at this scope in more detail. Right click on it and choose ‘Review in Summary View’, so we can see what is retaining it:
- We can now see the root scope for the actual view.
- We can see the usual pattern of
$$ChildScopeand$parentproperties, but what else have we got?
Intestingly we can see that our scope is also retained by a context variable called $scope. How do I know it is a context variable? It’s in blue, part of the colour coding (see Mystery 3).
What is a context variable?
A closure is a function which refers to a variable outside of its definition. A context variable is the variable stored in a function context. A function context contains the environment for a closure, which is the data required to execute it.
So basically we have a closure which refers to a variable called $scope, which is the root scope of our view. We can see in detail the closure:
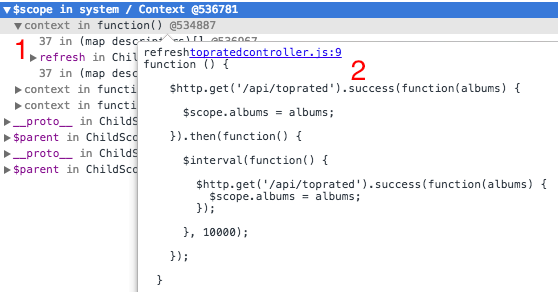
$scopeis retained by acontextfor a closure.- The closure is in the
refreshfunction (this is why thecontextis retained byrefresh).
We can open the function and examine it for issues. There’s an $http.get which has as closure which uses $scope, but alarmingly there is an $interval registered to run every 10 seconds, which is never deregistered. The interval callback uses another $http.get, with a closure that uses $scope. This is the problem.
A simple timeout we forgot to deregister has a closure on $scope. $scope can therefore never be cleaned up, because it is retained by a context.
Some important takeaways:
- The framework hides implementation details. Often useful, but in this case it made finding the leak a problem.
- This example seems contrived, but how how often do you have a closure using
$scopein a controller? In real world apps all of the time time, callbacks to ajax requests, event handlers, promise functions etc. - A leak of a small object that contains the data for three albums has leaked a large graph of other objects, and even DOM elements.
Leaks are not incremental. You don’t get an accumulation of small leaks, one small leak can retain a huge graph.
Let’s talk about this a bit more.
Dealing with Object Graphs
We saw before that a chain of retainers can pin an object, such as a scope, to a GC root. We also saw that AngularJS scopes are part of a highly connected graph, meaning that if we leak part of it, we probably leak it all:
However, things can get worse. Remember how in an angular app you can get the scope for an element with $(selector).scope()? This connection between a scope an an element is maintained in the jQuery data cache. This lets us associate arbitrary data with an element. This introduces another layer of connectivity:
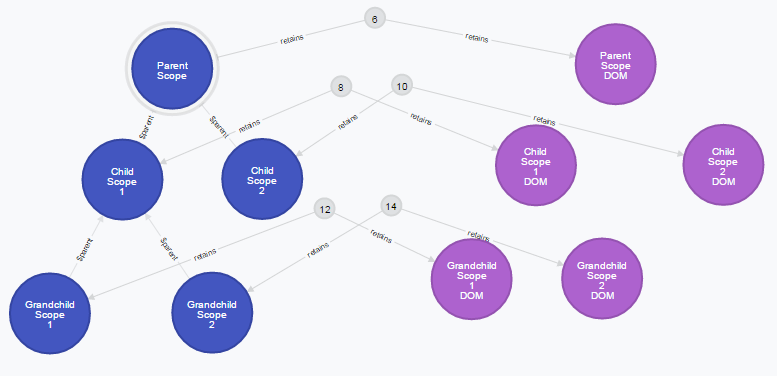
In this graph, we see the jQuery data cache entries (in grey) associating DOM elements to scopes, introducing more connectivity.
We can see here an alarming increase in the size and potential complexity of the graph. We’ve got DOM elements in play now. The chances are that if you are reading this you are dealing with a memory leak in your app, if it’s noticable enough for you to deal with it, you probably have a non-trivial graph.
So how do we fix memory leaks? I’ll show three general approaches and how to use each one.
Fixing Memory Leaks
Fixing memory leaks is hard. As we have seen our problem is highly connected graphs. If we have a part of the graph we want to free for garbage collection (such as a scope and all of it’s children, such as a view or directive) then we must not retain that graph of objects. This means if you have (for example) three problems that lead to retaining a graph, you have to fix all of the problems before the leak goes away.
Let’s generalise the best practices first into three rules, see patterns we should follow for each of them and then look at anti-patterns to avoid.
Three Golden Rules
Rule 1: Understand the framework and lifecycle.
If you are using a framework like AngularJS, you must understand the lifecycle of the objects you are dealing with. Unless you understand how the framework tries to clean up, you may make mistakes that stop it from working.
Rule 2: Be careful at the interface between short and long lived objects.
Whenever you see an interface between a short and long lived object, be extra careful. For example, if you have a directive talking to a service, make sure the service cannot retain the directive through closures, callbacks or any references. Services will last for the lifetime of the application, so they are the sort of object which can inadvertantly retain short lived objects.
Other long lived objects exist but may be more subtle, the interface between AngularJS and other libraries can be a risky area, if other libraries maintain long lived state.
Finally, consider this. The isolated scope for a directive (for example) may inadvertantly be long lived - if it is leaked. That leads us to Rule 3.
Rule 3: Disconnect the graph.
You can be defensive by manually disconnecting graphs of objects. This can aid if you have a memory leak you cannot resolve. By disconnecting the graph, the garbage collector will at least be able to attempt to clean up parts of it.
AngularJS should attempt to do this for you, for example when scopes are destroyed the links to other scopes are severed. But you can also do this yourself. Disconnecting the graph is not always as simple as emptying arrays or nulling objects, it can mean nulling closures and context variables too5.
The anti-patterns which follow are all violations of these rules.
Anti-Patterns to Avoid
Whether or not your app is suffering from memory leaks, avoid these patterns.
Poorly Managed Event Handlers
Consider a trivial example in a directive link:
function(scope, element, attrs) {
  element.on('click', function() {
    scope.selected = true;
  });
}
We register an event handler. We’ve now built a closure which will have a context, which retains the scope. If we don’t deregister this event handler, we retain the closure, the context, the scope, and then basically everything in the universe.
The Fix
function(scope, element, attrs) {
  element.on('click', function() {
    scope.selected = true;
  });
  scope.$on('$destroy', function() {
  	element.off(); // deregister all event handlers
  })''
}
Note: Angular should handle this. It is supposed to deregister event handlers on elements it manages. In my experience this isn’t always the case, although it seems cases when this doesn’t happen are fewer and fewer as bugs get fixed in the framework. Anyway, Rule 3 - disconnect.
Poorly Managed Watchers
Watchers or angular event handlers, basically the same as above.
$scope.$on('someEvent', function() {
	$scope.refresh();
})
Again, Angular should clean this up if you forget to, but the advice is always do it yourself. Angular watchers return a deregister function.
The Fix
var cleanup = $scope.$on('someEvent', function() {
	$scope.refresh();
});
$scope.$on('$destroy', function() {
	cleanup();
})
Rule 1 - know the framework and how lifecycle is handled. $destroy is sent to a scope specifically to allow it to be cleaned up.
Callback Functions on Services
Services (or other long lived objects) should typically not take callback functions. Imagine a ‘user service’, allowing a scope to discover if the user has changed their name:
UserService.onNameChange(function(newName) {
	$scope.userName = newName;
});
Now the service (a long lived object) takes a closure with a context to a short lived object, the scope. Unless the service is written absolutely correctly, we run the risk of the service retaining the scope. Remember, services are singletons and as such the interface between services and scopes is one that requires careful management.
There are two fixes I would suggest.
Fix 1: For a one-off operation, use a promise
// change and name and wait for the result
UserService.changeName("Fry").then(function(newName) {
	$scope.name = newName;
});
The notification service returns a promise (a short lived object) which holds the closure. If we get things wrong, we are less likely to leak the scope. Plus, promises are typically easy to work with once you’ve got the hang of them6.
Fix 2: For notifications, use broadcasts
// more like our original example
$scope.$on('NotificationService:ChangeName', function(data) {
	$scope.name = data;
});
Some will say to not overuse broadcasts as they can be expensive. They can, so use them judiciously. But remember, they’re provided by the framework, typically lead to fairly loose coupling and are probably managing clean up as well or better than a hand-rolled mechanism in a service. Rule 2 - don’t tie short lived objects to long lived objects.
The Future
That’s a wrap. Hopefully this article will grow and improve with feedback from the community. To wind up, lets look at a few things that are on their way which will touch on these issues.
Weak Maps
Finally, in ECMAScript 6 we will get a WeakMap7 object. This is ideal for something like the jQuery data cache. A weak map uses weak references (not natively supported in JavaScript). This means that we can map a DOM element to a scope in a weak map, but the map entry doesn’t retain the element or scope. If the element or scope is cleaned up, the map entry is removed. This means internal structures to aid with frameworks don’t need to necessarily retain object graphs.
AngularJS 2
Simplifications to the framework in 2.0 and usage of native features like web components mean less complex framework code and less scope for issues. Consider even the usage of classes in Angular 2.0. We don’t decorate a scope object (of type Object) we create an instance of a class. Easier to see in the heap view.
Even Better Browsers
SPA frameworks are driving improvements to browsers. Frameworks like Angular lead to more SPAs. More SPAs mean we find more bugs and edge cases in browsers. Many memory leak issues in AngularJS have led to fixes in V8.
Appendices
Beware any write up long enough to need appendices.
Thanks
Much of my understanding here came from working with others on real-world issues. I would like to thank the following people for their advice and insights:
James Denning, Shaun Bohannon, Arnaud Rebts, Colin Montgomery, Jon Hamshaw, Christian Lilley, Maarten De Wilde
There are others I have worked on with in this area, if I have forgotten to mention you please let me know.
Mysteries
After a large amount of time spent investigating memory leaks, there are still some things which to me are a mystery. If anyone can shed some light, I’d be interested to know.
Mystery 1: False Charts
As mentioned earlier we cannot always trust the timeline, it is not uncommon to see the memory usage in the timeline increase, even though the size of snapshots seems to be staying constant. This may be related to AngularJS Issue DOM Nodes Leaking.
Mystery 2: Odd Snapshot Sizes
It is not uncommon for the first snapshot to be large, and then subsequent snapshots to all be a bit smaller (even without any state changes). Why this is the case I do not know. To test, run an angular app and take some snapshots without doing anything in between. You’ll normally see (for example) 9 MB, 9MB, 9MB. However, it is not uncommon to see 15 MB, 9MB, 9MB.
Mystery 3: Where’s the colour coding documentation?
The Chrome documentation states that the colour coding key for elements in the heap snapshot is available in the tool. I can’t find it anywhere, so had to research to find the details.
Further Reading
Still not had enough? Try these.
- Profiling Memory Performance
- Memory Analysis 101
- Heap profile containment
- Dev tools tips & tricks
- JavaScript Memory Profiling
- Memory Management
- Taming the Unicorn
1. This is C actually, but the syntax isn’t important, just the logic of what we’re doing.↩ 2. In JavaScript as in most managed languages, the mechanism by which this happens is reference counting and garbage collection. There’s a superb description at JavaScript Memory Management.↩ 3. Try it yourself with this fiddle for a sawtooth pattern.↩ 4. Try it yourself with this fiddle for a ‘steps’ pattern.↩ 5. See this commit in my Angular Modal Service for an example of how nulling context variables (i.e. disconnecting the graph) solved a memory leak. This is a good example of how are it can be, after large amounts of analysis I still haven’t discovered why this was needed, but it solved the problem. It may relate to Mystery 4.↩ 6. See my article Promises in AngularJS - The Definitive Guide if you are not sure how to use them.↩ 7. More details at https://developer.mozilla.org/en/docs/Web/JavaScript/Reference/Global_Objects/WeakMap↩